Appearance
TLT
fiscaldata.treasury.gov
- How much revenue has the U.S. government collected this year?
- How much has the U.S. government spent this year?
- What is the national deficit?
- What is the national debt?
- Interest Expense and Average Interest Rates on the National Debt FY 2010 – FYTD 2025
- How much has been invested in savings bonds this year?
- Debt to the Penny
- Historical Debt Outstanding
- U.S. Treasury Monthly Statement of the Public Debt (MSPD)
- Average Interest Rates on U.S. Treasury Securities
USASpending.gov
Articles
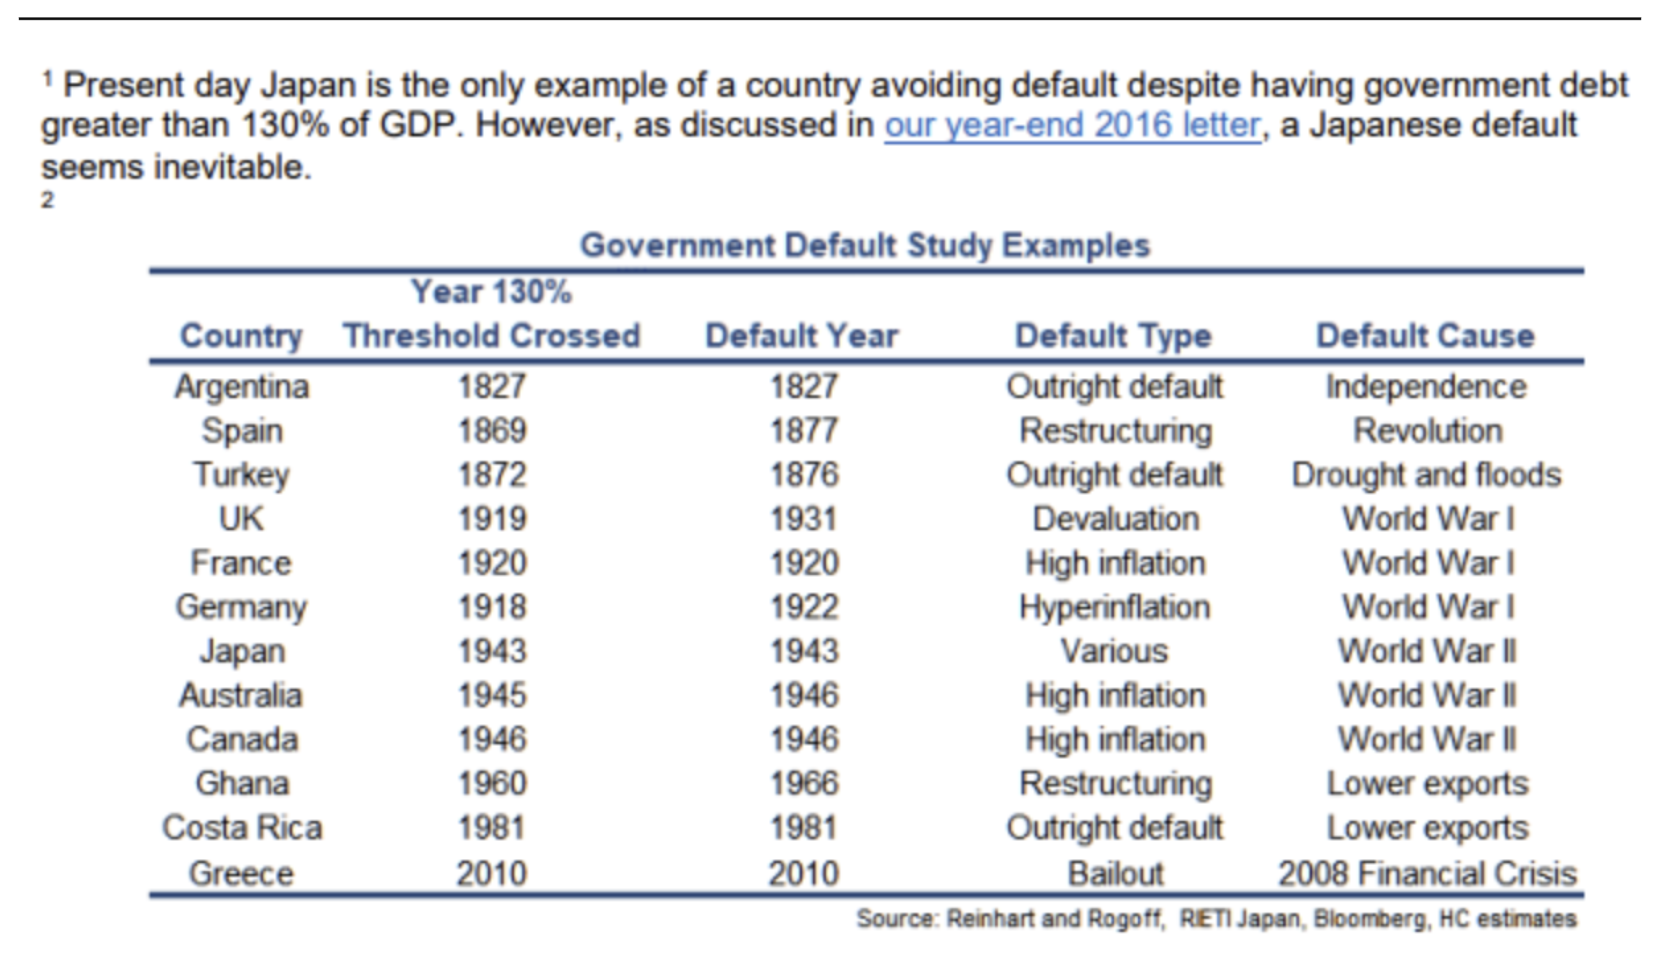
As of December 2024, The United States debt is currently 124% of it’s GDP. This was before GDP was forecasted to shrink in Q1, while Debt is forecasted to continue to rise, even with the efforts of DOGE. This will certainly bring the U.S. into the dreaded 130% Debt/GDP region. Since 1981, 98% of all countries that have reached the 130% Debt/GDP ratio have defaulted on their bonds.
To put this into perspective, the budget deficit for the fiscal year 2024 came in around $1.9 Trillion, or 6.7% of GDP. There is no other year in US history where the budget deficient was this large outside of a major war, like WW I & WW II, or dealing with a major recession, like 2008. It is unheard of to have fiscal spending this high, in an expanding economy, with historically low unemployment.
the U.S. has to refinance $9.2 Trillion in US debt in 2025 with an estimated $28 Trillion in debt needing to be refinanced over the next 4 years. The cost to refinance this debt will depend on the yield the market is demanding to hold a US government bond until maturity. The lower ETFs like TLT go, the more of a problem the US will have to refinance this debt, further exacerbating the runaway bond market scenario.
For reference, as of February 2025, it currently costs $478 Billion annually to maintain the US debt. This is roughly 16% of the total Federal Spending. Also, for the first time in history, it now costs us more to service the debt than we spend on defense annually.